A.I. PRIME - Article
Measure AI ROI: KPI Framework for Founder-Led Teams Automating Operations
Measure intelligent automation ROI with proven KPI frameworks and metrics that matter to CDOs.

You've invested in AI workflow automation. Your team is processing more work. Response times are faster. But when your board asks "What's the actual return on this investment?" - can you answer with confidence and numbers that stick?
Most founder-led B2B teams struggle with this exact problem. They see operational improvements happening in real time, but quantifying ROI feels fuzzy. Without clear metrics, it's hard to justify continued investment, scale to new workflows, or convince stakeholders that automation was worth the effort.
This guide gives you a practical KPI framework designed specifically for small B2B teams and service-oriented businesses. We'll show you which metrics matter, how to measure them without becoming a data analyst, and how to build a simple business case that proves automation ROI to your team and your board.
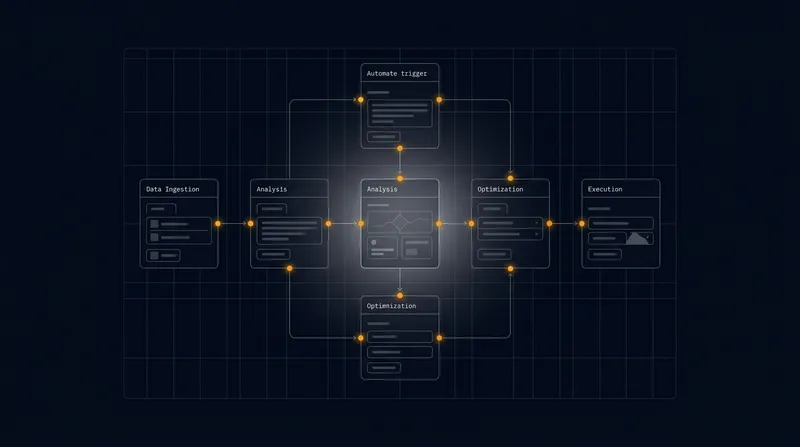
The Five Metrics That Actually Drive ROI for Small B2B Teams
Measuring AI automation ROI doesn't require complex financial modeling or enterprise dashboards. It requires tracking the right five metric categories - the ones that directly connect to your business outcomes. Learn more in our post on Measuring AI ROI: Metrics that Matter for CDOs Leading Automation Initiatives.
Throughput metrics show how much more work your team processes without hiring more people. This is the raw capacity multiplication - how many customer requests, support tickets, or sales follow-ups can you handle now versus before automation?
Time savings metrics measure how much faster repetitive tasks complete. Faster lead response, quicker support ticket resolution, or accelerated order processing directly impact customer experience and cash flow. These are the metrics your team feels immediately.
Cost avoidance metrics quantify the labor hours automation eliminates. This isn't about firing people - it's about preventing the need to hire as you grow. For a 10-person team handling 30% more volume with the same headcount, that's significant cost avoidance.
Quality and error reduction captures fewer mistakes, less rework, and happier customers. Automated processes execute consistently. They don't miss steps or lose context. The compounding value of fewer errors often exceeds the direct cost savings.
Revenue impact tracks how automation enables faster sales cycles, better lead qualification, or improved customer retention. These are the metrics that make automation a growth lever, not just an efficiency play.
Establish Your Baseline: Measure Before You Automate
You can't prove improvement without knowing where you started. Before deploying any automation, spend one week documenting your current-state metrics. This baseline is your ROI anchor. Learn more in our post on Master Agentic AI Performance: Core Metrics That Drive Business Results.
What to measure in your baseline
For each process you're automating, capture: How many transactions does your team process daily? How long does each one take from start to finish? How many errors or rework cycles happen? What does one person's fully loaded cost look like (salary, benefits, overhead)? How many customers are waiting for responses at any given time?
You don't need perfect data. Rough estimates based on sampling work fine. If your support team handles 50 tickets per day on average, and cycle time is roughly 4 hours per ticket, you have your baseline. Document it in a simple spreadsheet. That's your measurement foundation.
Simple infrastructure for tracking metrics
Most founder-led teams don't need sophisticated dashboards. A Google Sheet updated weekly works. What matters is consistency - measuring the same metrics the same way, every week, so you can see trends.
Set up columns for: Date, Transactions Processed, Average Cycle Time, Error Rate, Team Hours Spent, Customer Response Time. Populate it from your actual systems - your CRM, support platform, or time tracking tool. Automate the data pull if you can. Manual entry is fine if it takes 15 minutes per week.
The goal isn't perfection. The goal is visibility into whether automation is actually delivering the outcomes you expected.
Throughput: How Much More Can You Handle?
Throughput is the easiest metric to measure and often the most impressive. It directly answers: "Are we processing more work without hiring?" Learn more in our post on Building a Credible Business Case for Enterprise AI Automation: Time-to-Value Forecasting and ROI Modeling.
Transactions processed per day
Count how many customer requests, support tickets, sales follow-ups, or orders your team processes daily. Before automation, your support team might handle 50 tickets per day. After automation routes tickets intelligently and auto-generates responses for common issues, you handle 75 tickets per day with the same team.
That 50% throughput increase is real ROI. You're serving 50% more customers without 50% more staff.
Track this metric weekly. You'll see it climb as your team gets comfortable with the automation and as the system learns your patterns. Most teams see 30% to 60% throughput improvements in the first 30 days.
Peak capacity during high-demand periods
Automation shines during volume spikes. When you get a rush of customer requests - holiday season, product launch, or seasonal demand - automation absorbs the spike without breaking. Manual teams would require temporary staff. Automation scales for free.
Document your peak demand periods. How much volume did you handle during your busiest week last month? Could you have handled 50% more? Track whether automation lets you handle volume spikes that would have required hiring before.
Cycle time: End-to-end speed
How long does a complete transaction take? Before automation, a sales lead might take 3 days from inquiry to qualified opportunity. After automation handles initial qualification and follow-up, that's 24 hours.
Faster cycle time compounds. Faster lead response increases conversion. Faster support ticket resolution improves customer satisfaction. Faster order processing improves cash flow. Track cycle time weekly. Most teams see 40% to 70% improvements.
Time and Cost Savings: The Labor Multiplier
This is the metric that justifies automation investment to finance-minded stakeholders. How many team hours does automation eliminate?
Labor hours saved per week
Track how much time your team spends on the automated process before and after. Before automation, your support team spends 80 hours per week on ticket handling. After automation handles initial triage, response drafting, and escalation routing, that's 50 hours per week.
You saved 30 hours per week. At a fully loaded cost of $40 per hour (salary plus benefits plus overhead), that's $1,200 per week in labor cost avoidance. Over a year, that's $62,400.
This is cost avoidance, not cost reduction. You're not firing anyone. You're preventing the need to hire as volume grows. That's a cleaner story for your team and more defensible financially.
Rework and error costs eliminated
Manual processes create rework. A support agent misses a detail, the customer responds again, you handle it twice. A sales team member sends a follow-up to a customer who already converted. An operations team member enters data incorrectly, causing downstream problems.
Estimate your rework rate. If 15% of tickets require rework, and rework takes 2 hours per ticket, you're spending significant time fixing mistakes. Automated processes execute consistently. They catch missing information before escalating. They don't send duplicate communications.
Measure rework frequency before and after automation. Most teams eliminate 40% to 70% of rework. If you eliminated 70% of rework, calculate the hours saved and multiply by your hourly cost. That's real ROI.
Revenue Impact: How Automation Drives Growth
The most compelling ROI story connects automation to revenue. Efficiency is good. Growth is better.
Sales cycle acceleration
How long does a deal take from first contact to signature? Automation that handles initial qualification, sends timely follow-ups, and generates proposals faster directly shrinks that cycle.
If your average deal takes 45 days and automation cuts that to 30 days, you're closing deals 33% faster. For a team closing 10 deals per month at $50,000 average deal size, faster cycles mean $500,000 in additional annual revenue from the same deal volume closing sooner.
Track deal cycle time by customer segment. Some deals may accelerate more than others. Track conversion rate too - faster response often improves conversion, which is additional revenue on top of cycle acceleration.
Improved lead qualification and conversion
Automated lead qualification systems score leads faster and more consistently than humans. They identify high-potential opportunities and route them to your best salespeople immediately.
Measure conversion rates at each stage of your funnel. If automation improves lead-to-opportunity conversion from 25% to 30%, that's a 20% conversion improvement. For a team generating 100 leads per month, that's 5 additional qualified opportunities per month - significant revenue impact.
Customer retention and lifetime value
Faster response times and consistent service improve customer satisfaction. Better satisfaction means lower churn. Even a 2% to 3% improvement in retention compounds significantly over time.
Track customer churn rate before and after automation. If churn drops from 5% to 3%, and your average customer lifetime value is $10,000, you're retaining an additional $200,000 in annual revenue for every 100 customers.
Quality and Error Reduction: The Compounding Benefit
Automation's consistency creates compounding value. Fewer errors mean less rework, happier customers, and cleaner data for future decisions.
Error rate and defect frequency
How often does your team make mistakes? Data entry errors, missed steps, forgotten follow-ups. Estimate your error rate - errors per 100 transactions.
Manual processes typically have 5% to 15% error rates. Automated processes have 0.5% to 2% error rates. The difference is significant.
Track error rate weekly. Document what errors occur and what they cost - customer service time to fix, potential lost revenue, compliance risk. Most teams find that error reduction alone justifies automation investment.
Compliance and risk reduction
Automation creates audit trails and enforces consistent process execution. In regulated industries - financial services, healthcare, or legal - this compliance value is enormous.
If automation prevents even one compliance violation that would have cost $50,000 in fines or remediation, it's paid for itself. Track compliance violations and audit findings. Quantify the cost of violations your team has experienced historically.
Build Your ROI Calculation: Simple Math for Real Impact
Now that you're tracking metrics, calculate ROI. You don't need complex financial modeling. Simple math works.
Annual value calculation
Start with labor cost avoidance. If you save 30 hours per week at $40 per hour, that's $62,400 annually. Add error reduction savings - if you eliminated $20,000 in annual rework costs. Add revenue acceleration - if faster cycles generated $100,000 in additional revenue from improved cash flow timing.
Total annual value: $62,400 + $20,000 + $100,000 = $182,400.
If your AI automation implementation cost $20,000 (either platform licensing or professional services), your payback period is 1.3 months. Your year-one ROI is 812%.
These numbers are real for founder-led teams. A.I. PRIME's 14-day engagement delivers working automation fast, which means ROI compounds quickly.
Year two and beyond
Year one includes implementation cost. Year two is pure benefit. If you're capturing $182,400 in annual value with no additional implementation cost, that's your sustainable annual ROI.
As you expand automation to additional workflows, you add more value. Most teams automate 3 to 5 workflows in year one, then expand to 8 to 12 workflows by year three. The compounding effect is powerful.
Track Metrics Weekly: Build the Habit
The difference between teams that see ROI and teams that don't is consistency. Teams that measure weekly see trends. Teams that measure quarterly miss the story.
Weekly measurement routine
Every Friday, spend 15 minutes updating your metrics sheet. Pull transaction counts from your systems. Ask your team how much time they spent on the automated process. Note any errors or issues.
That 15-minute habit gives you complete visibility into whether automation is delivering. After 4 weeks, you have a trend. After 12 weeks, you have a story to tell your board.
Monthly review and optimization
Once monthly, review your metrics with your team. Where are we seeing the biggest improvements? Where is automation underperforming? What should we optimize?
Most automation systems improve over time as they learn your patterns and your team learns how to work with them. Monthly reviews help you identify optimization opportunities quickly.
Communicate ROI to Your Board and Stakeholders
You've measured. You've calculated. Now tell the story.
The simple narrative
Start with throughput: "We're processing 50% more customer requests with the same team." That's impressive and immediately credible because your team sees it daily.
Then add time savings: "That 50% throughput improvement freed up 30 hours per week of team capacity." Quantify it: "$62,400 in annual labor cost avoidance."
Then add revenue impact: "Faster response times improved our lead conversion rate by 20%, generating $100,000 in additional annual revenue."
Then the ROI: "Our automation investment paid for itself in 6 weeks. We're capturing $182,000 in annual value."
That narrative is clear, credible, and compelling. It doesn't require a finance degree to understand.
Visualize the metrics
Create a simple dashboard showing your five key metrics trending upward over time. A chart showing throughput climbing from 50 to 75 transactions per day is more powerful than a spreadsheet. A line showing cycle time dropping from 4 hours to 2.5 hours tells the story visually.
Tools like Google Data Studio or even Excel charts work fine. The goal is to make the ROI visible and memorable.
Common Pitfalls and How to Avoid Them
As you measure ROI, watch out for these common mistakes.
Measuring too many metrics
Tracking 20 metrics sounds thorough. It's actually paralyzing. Focus on the five we've outlined. They tell the complete story. Everything else is noise.
Measuring too infrequently
Quarterly measurement misses trends. Weekly measurement shows you what's working and what needs adjustment. Make it a habit, not a special project.
Ignoring the human side
ROI metrics are important, but team satisfaction matters too. If automation is driving metrics up but your team hates using it, you'll struggle to scale. Ask your team for feedback. Optimize for both metrics and usability.
Confusing correlation with causation
If revenue went up after you deployed automation, that's great. But was it automation or a new marketing campaign? Be honest about what drove improvements. If multiple things changed simultaneously, acknowledge that.
From Measurement to Continuous Improvement
Measurement isn't a one-time exercise. It's the foundation for continuous improvement.
As you track metrics, you'll identify where automation is delivering the strongest ROI and where it's underperforming. Use that insight to optimize. Retrain your team on underperforming workflows. Adjust automation rules based on what you're learning. Expand automation to additional workflows where you see strong ROI potential.
The teams that win with AI automation are the ones that measure relentlessly, optimize continuously, and expand systematically. They start with one workflow, prove ROI, then scale to five workflows, then ten.
At A.I. PRIME, we build measurement directly into our automation deployments. Our 14-day engagement doesn't just deliver working automation - it delivers a measurement framework you can use immediately. We help you establish baselines, set up tracking, and interpret results so you can prove ROI to your stakeholders and identify optimization opportunities.
We work with founder-led teams and small B2B operators who need rapid, measurable improvements. Our approach is practical and grounded. We measure what matters. We track it consistently. We help you tell the ROI story to your board.
Ready to measure your automation ROI? Start this week. Document your baseline. Set up your metrics sheet. Deploy your automation. Then measure weekly for 12 weeks and watch the ROI compound.
The teams that measure are the teams that scale. Let's get started.
Conclusion
Measuring AI ROI isn't optional for founder-led teams automating operations - it's essential. Without a clear framework, you're flying blind, unable to justify continued investment or identify where to optimize next.
The KPI framework we've outlined gives you a structured approach: establish baselines, select metrics aligned to your business goals, track consistently, and avoid common pitfalls like vanity metrics and measurement gaps. Whether you're focused on time savings, cost reduction, quality improvement, or revenue impact, the principles remain the same.
The real power emerges when you move beyond measurement into action. Weekly tracking reveals patterns. Honest analysis uncovers what's actually driving improvements. Continuous optimization turns early wins into sustained competitive advantage. Teams that measure systematically scale faster, prove value to stakeholders more convincingly, and build internal buy-in for broader automation initiatives.
Start small. Pick one workflow. Document your baseline metrics. Deploy automation. Measure weekly for 12 weeks. Let the data guide your next moves. This disciplined approach transforms AI from a hopeful experiment into a measurable business driver.
Your automation ROI story starts with measurement. Make it your priority this quarter, and you'll have the evidence and insights needed to scale confidently into the next.
Next step
Book the Opportunity Sprint