A.I. PRIME - Article
Cost Modeling: How Agentic AI Reduces Total Cost of Ownership vs. Traditional Automation
Discover how agentic AI reduces total cost of ownership versus traditional automation with practical cost models and real scenarios.
The choice between agentic AI and traditional automation is no longer theoretical. Finance teams, IT leaders, and operations managers need clear, evidence-based cost models to justify Q3 and Q4 investments. This article compares agentic AI with robotic process automation and rule-based tooling, offering a practical step-by-step cost model, real scenario analysis, sensitivity frameworks, and ready-to-use budget templates you can adapt immediately. You will learn how to identify inputs, quantify maintenance and error costs, estimate opportunity upside, and determine whether an agent approach delivers lower total cost of ownership than traditional automation. The goal is concrete: build a defensible case to procurement and finance by combining strategic guidance with actionable numbers.
Executive Summary: Why Agentic AI Often Wins on TCO
Agentic AI refers to systems that autonomously plan, reason, and execute multi-step tasks across systems with adaptive decision-making. Traditional automation includes RPA, rule engines, and scripted integrations that follow deterministic flows. The core question is whether agentic AI reduces total cost of ownership when applied to real business processes over a three-year planning horizon. Learn more in our post on Cost Modeling: How Agentic AI Lowers Total Cost of Ownership vs. Traditional Automation.
The thesis is straightforward: agentic AI lowers TCO relative to traditional automation in predictable circumstances. Agentic AI wins when processes exhibit complexity, variability, frequent exceptions, or require reasoning across unstructured data sources. Traditional automation retains advantages in simple, high-volume, highly standardized tasks where deterministic rules suffice and change is rare.
Key drivers that favor agentic AI include reduced manual exception handling, lower maintenance effort as business rules evolve, faster time to value when requirements change, and the ability to capture opportunity value from intelligent routing and decision-making. Rule-based systems can be cheaper to build upfront but carry higher long-term maintenance and error costs as processes diverge from their original specifications.
Defining the Landscape: What You Are Comparing
To compare costs accurately, you must define what each approach means in practice. Traditional automation covers RPA bots, deterministic APIs, and rule engines. These tools execute defined scripts, map fields, and route transactions if preconditions are met. They excel when inputs are consistent and business logic does not change frequently. Learn more in our post on Agentic AI vs Traditional RPA: Which Automation Approach Wins for Your Business.
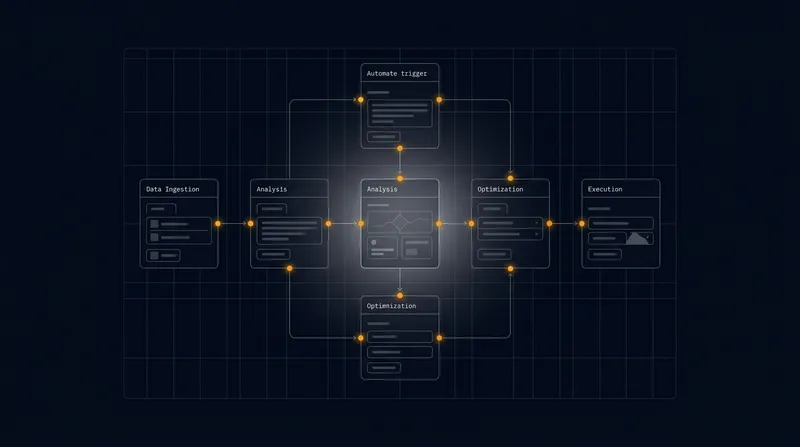
Agentic AI combines large language models, planning modules, and connectors to perform tasks autonomously. Agentic systems can read emails, extract entities, call APIs, prioritize tasks, and make tradeoff decisions based on objectives. They handle unstructured inputs and adapt to novel situations without bespoke rule changes.
The difference is essential when constructing a cost model. Traditional automation costs are concentrated in initial development and rule management. Agentic AI costs include model compute, prompt engineering, monitoring, and safety controls. The distribution of those costs over time determines which approach delivers lower TCO.
Operational Characteristics That Drive Cost
Five operational dimensions influence whether agentic AI or traditional automation delivers better economics.
- Volume and frequency: High message volumes favor simple automations to amortize fixed development costs across more transactions.
- Variability: Frequent changes push maintenance costs higher for rule-based tooling because each variation requires new rules.
- Exception rate: High exceptions increase manual handling costs for traditional automation, making intelligent exception handling valuable.
- Decision complexity: Tasks requiring judgment or context integration favor agentic AI over rigid rule sets.
- Regulatory constraints: Strict audit and explainability needs may increase governance costs for agentic approaches, offsetting some savings.
Building Your TCO Model: Five Cost Buckets
Constructing a TCO model requires consistent categories and a realistic time horizon. Use a three-year horizon for planning because it balances initial investment with longer-term maintenance realities. The model should include five core cost buckets that capture the full lifecycle of each approach. Learn more in our post on When to Choose Agentic AI Over Traditional Automation: A Founder's Decision Framework.
- Development and implementation costs
- Infrastructure and licensing
- Ongoing maintenance and updates
- Exception handling and error costs
- Opportunity and productivity impact
Below is a step-by-step approach to estimate costs for each bucket and build a comparison.
1. Development and Implementation
Traditional automation requires analyst and developer hours for process mapping, script building, connector configuration, and testing. Include time for building test data and initial exception workflows. A typical billing reconciliation might require 400 hours of combined analyst and developer effort.
Agentic AI requires prompt and agent design, training or fine-tuning if applicable, integration engineering to connect agents to systems of record, and validation cycles for decision logic. Factor in iterative tuning to reduce hallucinations and ensure compliance. The same billing reconciliation might require 600 hours including model tuning and safety validation.
To calculate implementation cost:
- List required roles and fully burdened hourly rates (include salary, benefits, overhead).
- Estimate total hours per role for initial build based on process complexity.
- Multiply hours by rates and sum for total implementation cost.
At a blended rate of $120 per hour, traditional automation costs $48,000 while agentic AI costs $72,000 in this example. This upfront difference is material but only the first piece of the puzzle.
2. Infrastructure and Licensing
Traditional automation typically incurs one-time license fees and hosting costs. Agentic AI has compute costs, API usage fees, and possibly model hosting or cloud consumption charges. Some agentic platforms bill based on cycles, tokens, or per-agent runtime.
Include forecasting for usage growth. Estimate monthly cost and multiply across the planning horizon. For example, traditional RPA might cost $2,000 per month in licenses and hosting while agentic AI might cost $5,000 per month in compute and API usage. Consider reserved commitments where possible to lower per-unit costs. Also include costs for logging, monitoring, and secure connectors.
3. Ongoing Maintenance and Support
Rule-based systems usually require regular rule changes as business processes evolve. Assign a percent of initial build effort per month as maintenance. A common heuristic is 10 to 20 percent of initial development per month for dynamic environments. If initial development cost $48,000, expect $4,800 to $9,600 per month in ongoing maintenance.
Agentic AI requires monitoring for drift, periodic prompt or model updates, and incident response for hallucinations or performance issues. Maintenance can be lower in many scenarios because agents adapt to new inputs without manual rule edits. However, governance and monitoring are nontrivial costs. Plan for 5 to 10 percent of initial development per month, plus dedicated monitoring staff.
4. Exception Handling and Error Cost
Measure the current exception rate and average cost per exception. Exceptions include manual effort to resolve failures, customer dissatisfaction, or financial losses due to incorrect automation. Traditional automation often shifts the burden of exceptions to people, raising ongoing costs significantly.
For customer support triage with 8,000 tickets per month, a 7 percent exception rate means 560 manual exceptions. If each takes 25 minutes to handle at $120 per hour, that is $28,000 per month in exception labor. Agentic AI reducing that to 1.5 percent means only 120 exceptions and $6,000 per month in labor. The $22,000 monthly difference drives TCO decisively in favor of agentic AI.
5. Opportunity and Productivity Impact
This bucket captures revenue uplift, capacity freed for redeployment, and faster cycle times. Quantify productivity gains in FTE equivalents and include their value over the time horizon. For example, if agentic AI frees 0.5 FTE per month that can be redeployed to sales support, that is 6 FTE per year at $120,000 fully burdened cost, or $720,000 in value over three years. This is often the largest contributor to net benefit when agentic AI outperforms traditional automation at scale.
Real Scenario Analysis: Three Representative Cases
Apply the model to three representative scenarios using consistent assumptions across all calculations.
Assumptions for all scenarios:
- Planning horizon: 36 months
- Blended fully loaded labor rate: $120 per hour
- Monthly infrastructure and license growth: 3 percent
- Process volume: expressed as transactions per month
- Exception handling cost: $40 per manual exception
Scenario A: High Volume, Low Complexity
Description: A billing reconciliation task with consistent structured inputs and fixed matching rules. Volume: 50,000 transactions per month.
Cost analysis:
- Traditional automation: Lower build cost ($48,000), low infrastructure fees ($1,500 per month), minimal maintenance at 5 percent of build per month, exception rate 0.5 percent (250 exceptions per month at $40 each = $10,000 monthly).
- Agentic AI: Higher initial build ($72,000) and compute costs ($4,000 per month), but minimal reduction in exceptions because the task is already deterministic.
Result: Traditional automation yields lower TCO due to simplicity and scale. Agentic AI is not cost-effective in this specific case unless additional value is generated such as analytics, dynamic prioritization, or cross-system insights.
Scenario B: Medium Volume, High Variability
Description: Customer support triage with emails, attachments, and changing guidelines. Volume: 8,000 transactions per month.
Cost analysis:
- Traditional automation: Higher maintenance due to frequent rule updates (15 percent of build per month), exception rate 7 percent (560 exceptions per month at $40 each = $22,400 monthly labor cost).
- Agentic AI: Higher initial integration cost ($72,000) but lower residual exception rate at 1.5 percent (120 exceptions per month at $40 each = $4,800 monthly labor cost), reduced maintenance effort because agents learn to handle new templates and formats.
Result: Agentic AI shows lower TCO over three years driven by reduced manual exception costs ($22,400 vs. $4,800 per month = $17,600 monthly savings) and lower maintenance overhead as business rules evolve. The implementation cost delta of $24,000 is recovered in approximately 1.4 months.
Scenario C: Low Volume, High Criticality
Description: Risk review for compliance-flagged transactions. Volume: 500 transactions per month.
Cost analysis:
- Traditional automation: Not suitable because deterministic rules cannot cover nuanced regulatory judgment. Manual review dominates costs at full analyst time.
- Agentic AI: Can assist reviewers by pre-populating analyses, providing citations, and ranking risk level, reducing average review time from 60 minutes to 20 minutes per transaction.
Result: Agentic AI provides productivity gains and reduces TCO by lowering human review time from 500 hours per month to 167 hours per month (a savings of 333 hours at $120 per hour = $39,960 per month). This alone justifies the investment.
Decision Framework: Weighted Scoring Model
Decisions should be based on measurable criteria rather than intuition. Use a weighted scoring model with the following dimensions. Rate each on a scale of 1 to 5, multiply by the weight, and sum to get a total score out of 5.
- Complexity and cognitive need (25%): Does the task require judgment, context, or reasoning beyond rule matching?
- Input variability and unstructured data (20%): How often do inputs deviate from expected formats?
- Change frequency (15%): How often do business rules or requirements change per year?
- Volume and scale (15%): How many transactions per month must the system handle?
- Compliance and explainability needs (10%): How strict are audit and transparency requirements?
- Opportunity upside from intelligence (15%): What is the value of better decisions, faster resolution, or revenue recovery?
Scoring method:
- Rate each dimension from 1 to 5 for the process under evaluation.
- Multiply by weights and sum to get a total score out of 5.
- Set thresholds for preferred approach. Total score above 3.2 favors agentic AI, below 2.8 favors traditional automation, and 2.8 to 3.2 calls for a hybrid trial.
Sample scoring for customer support triage:
- Complexity: 4
- Variability: 5
- Change frequency: 4
- Volume: 3
- Compliance: 3
- Opportunity upside: 4
Weighted total: (4 x 0.25) + (5 x 0.20) + (4 x 0.15) + (3 x 0.15) + (3 x 0.10) + (4 x 0.15) = 3.85. Recommendation: agentic AI preferred.
Q3 Budget Templates: Ready-to-Use Line Items
Below are template line items to include in Q3 budgets. Paste these into a planning spreadsheet and adjust values based on your organization and labor rates.
Template A: Traditional Automation Budget
One-time implementation:
- Process mapping and analysis: 120 hours at $120 per hour = $14,400
- Developer implementation: 280 hours at $120 per hour = $33,600
- Testing and QA: 80 hours at $120 per hour = $9,600
- One-time licenses and connectors setup: $1,500
- Total one-time: $59,100
Monthly operating:
- Hosting and license fees: $2,000 per month
- Maintenance and change requests: 10 percent of implementation cost per month = $5,910
- Exception handling manual labor: (volume x exception rate x 25 minutes per exception / 60) x $120 per hour
- Total monthly: $7,910 plus exception labor
Template B: Agentic AI Budget
One-time implementation:
- Agent design and prompt engineering: 160 hours at $120 per hour = $19,200
- Integration engineering: 320 hours at $120 per hour = $38,400
- Model fine-tuning or dataset preparation: 120 hours at $120 per hour = $14,400
- Security and compliance setup: 80 hours at $120 per hour = $9,600
- Total one-time: $81,600
Monthly operating:
- Compute and API costs: forecast by transactions or minutes of agent runtime (typically $3,000 to $6,000 per month for medium volume)
- Monitoring and governance: $2,000 per month
- Model updates and maintenance: 5 percent of implementation cost per month = $4,080
- Exception handling manual labor: (volume x residual exception rate x 25 minutes per exception / 60) x $120 per hour
- Total monthly: $9,080 plus compute and exception labor
How to adjust templates for your company:
- Replace hourly rates with your blended burdened rates (include salary, benefits, overhead, and allocation).
- Estimate realistic exception rates pre- and post-automation based on current state metrics.
- Forecast transaction volume growth for the next 12 months to size compute needs accurately.
- Model sensitivity by varying maintenance percent and exception costs by plus or minus 50 percent to identify risk drivers.

Implementation Roadmap and Governance Structure
Rolling out agentic AI requires a governance plan that addresses model safety, auditability, and escalation paths. Follow a phased implementation to reduce risk and manage costs predictably.
Recommended implementation phases:
- Pilot (weeks 1 - 8): Choose a medium-complexity use case, build a minimal viable agent, measure baseline metrics for accuracy and exceptions. Establish monitoring dashboards and exception escalation workflows.
- Scale (weeks 9 - 16): After pilot success, expand to additional processes and integrate with more systems of record. Automate monitoring to detect drift and exceptions. Document playbooks and train operations team.
- Operationalize (weeks 17+): Create playbooks for retraining, update cycles, and incident response. Assign clear ownership for agent health and governance. Measure KPIs weekly and adjust resource allocation based on actual performance.
Key governance roles and responsibilities:
- Owner: Business unit accountable for outcomes, budget, and stakeholder communication.
- Platform team: Handles integrations, runtime, cost optimization, and infrastructure.
- Model ops: Monitors performance, retrains models, manages updates, and investigates anomalies.
- Compliance and security: Ensures data handling, auditability, and regulatory alignment.
KPIs to monitor weekly:
- Residual exception rate (target: 50 percent reduction from baseline)
- Mean time to resolve incidents (target: less than 4 hours)
- Cost per transaction (baseline vs. post-implementation)
- FTE hours freed (track redeployment to higher-value work)
- Accuracy and precision of decisions (measure against human review)
Sensitivity Analysis and Risk Mitigation
Sensitivity analysis helps you understand which inputs drive the TCO comparison. Run scenarios that vary the following variables by plus and minus 25 to 50 percent:
- Exception rate delta between approaches (the biggest lever in most cases)
- Maintenance percent per month (higher for traditional in dynamic environments)
- Compute and API cost growth (can be higher than expected with volume spikes)
- Volume growth (affects infrastructure costs and amortization of development)
- Labor rates (includes both implementation and exception handling)
Common pitfalls to avoid:
- Underestimating maintenance for rule-based systems when processes are not static. Rules proliferate as exceptions emerge, driving costs higher than initial estimates.
- Overlooking governance costs for agentic AI including monitoring, logging, and incident response. These are real operational expenses.
- Failing to quantify opportunity value that intelligence unlocks, such as better prioritization, revenue recovery, or customer satisfaction improvement.
- Choosing the wrong KPI window. Small pilots that run for too short a period can misrepresent maintenance trends. Run at least 8 weeks to capture seasonal variation and rule changes.
- Ignoring retraining costs. Agentic AI models require periodic updates as data distributions shift. Budget for this explicitly.
Detailed Scenario Analysis with Payback Calculation
Let us work through a detailed example for medium-complexity customer support triage to show how numbers drive the decision.
Baseline assumptions for this scenario:
- Volume: 8,000 tickets per month
- Pre-automation exception rate: 12 percent (960 exceptions per month)
- Average handling time per exception: 25 minutes
- Labor rate: $120 per hour fully burdened
- Traditional automation residual exception rate: 7 percent (560 exceptions per month)
- Agentic AI residual exception rate: 1.5 percent (120 exceptions per month)
- Implementation hours: 400 for traditional automation, 600 for agentic AI
- Monthly infrastructure: $2,000 for traditional, $5,000 for agentic AI
Monthly exception handling cost calculation:
- Traditional automation: 560 exceptions x (25 minutes / 60) x $120 per hour = $28,000 per month in exception labor.
- Agentic AI: 120 exceptions x (25 minutes / 60) x $120 per hour = $6,000 per month in exception labor.
- Monthly savings from reduced exceptions: $28,000 - $6,000 = $22,000.
Monthly operating cost comparison:
- Traditional automation: Infrastructure $2,000 + maintenance (10% of $48,000 = $4,800) + exception labor $28,000 = $34,800 per month.
- Agentic AI: Infrastructure $5,000 + maintenance (5% of $72,000 = $3,600) + exception labor $6,000 = $14,600 per month.
- Monthly operating savings: $34,800 - $14,600 = $20,200.
Payback analysis:
- Implementation cost delta: (600 hours x $120) - (400 hours x $120) = $72,000 - $48,000 = $24,000 more for agentic AI.
- Monthly savings: $20,200.
- Months to recover implementation delta: $24,000 / $20,200 = 1.19 months.
- Three-year TCO for traditional automation: $48,000 + ($34,800 x 36) = $1,301,800.
- Three-year TCO for agentic AI: $72,000 + ($14,600 x 36) = $597,600.
- Three-year savings: $1,301,800 - $597,600 = $704,200.
Conclusion: Agentic AI achieves payback in just over one month and delivers over $700,000 in savings over three years due to large reductions in exception handling labor and lower maintenance as business rules evolve.

Operational Readiness Checklist
Before you commit budget for Q3, ensure operational readiness across these items. Each incomplete item introduces risk and can increase costs during rollout.
- Data access and connectors in place for the agentic solution. Test read and write access to all systems of record.
- Clear ownership for triage, incident response, and escalation. Define who owns each decision point.
- Logging and monitoring pipelines for model outputs and decisions. Ensure you can audit every action.
- Retraining cadence defined and resourcing allocated. Plan for monthly or quarterly updates based on drift detection.
- Security reviews and data classification completed. Confirm compliance with data governance requirements.
- Stakeholder communication and SLA impacts documented. Prepare teams for changes in process and response times.
Completing this checklist reduces risk and lowers unplanned costs during rollout. It also accelerates time to value by removing blockers early.
Final Recommendation and Q3 Roadmap
Use the decision framework and cost model to score every candidate process. Create a prioritized backlog with estimated TCO and expected payback period. The recommended roadmap for Q3 budgeting and deployment is:
- Run a scoring exercise across your top 20 candidate processes using the weighted framework. Identify the top 3 agentic AI candidates and top 1 traditional automation candidate for pilot comparison.
- Build a three-month pilot plan for the two highest-scoring agentic AI candidates. Include weekly KPI tracking, governance setup, and escalation procedures.
- Allocate budget lines based on the templates above. Include 20 percent contingency for unforeseen governance work, additional training, or system integration challenges.
- Track KPIs weekly for the pilot and reassess after eight weeks to inform Q4 scaling decisions. Document actual vs. estimated costs and adjust assumptions for future projects.
- Plan for scale based on pilot results. If payback is under three months and exception rates drop by 50 percent or more, accelerate rollout to additional processes in Q4.
Conclusion: Numbers-Driven Decision Making
The question of agentic AI vs. traditional automation is not binary. The cost modeling approach described in this article helps you make a pragmatic choice grounded in numbers rather than vendor claims or industry hype. Agentic AI tends to lower total cost of ownership when processes require judgment, handle unstructured inputs, or change frequently. In such cases, the higher initial cost is recovered quickly through reduced exception handling, lower maintenance effort, and opportunity gains from intelligent automation.
Traditional automation remains compelling for simple, high-volume, stable processes where predictable rule sets and deterministic workflows are the best fit. The key is matching the tool to the problem. A billing reconciliation task benefits from traditional automation. A compliance review task benefits from agentic AI. Most business processes fall somewhere in between, and the weighted decision framework helps you identify which approach fits best.
When preparing Q3 budgets, use the three-year horizon and the five cost buckets outlined in this article to create a side-by-side TCO comparison. Run sensitivity scenarios for exception rates, maintenance percent, and compute cost growth to identify risk drivers. Apply the weighted decision framework to prioritize pilots that are most likely to show rapid payback. For mid-complexity processes with high variability, the math often favors agentic AI because of its ability to generalize and reduce manual intervention. For low-complexity tasks, traditional automation preserves the best economics.
Operational readiness and governance determine real-world outcomes. A well-governed agentic deployment with robust monitoring, clear ownership, and frequent retraining can remain efficient and compliant. Similarly, a poorly maintained rule-based system can balloon costs as exceptions mount and rules proliferate. The templates and sample calculations provided above give finance and operations a starting point to build realistic budgets and anticipated timelines. Use them to make a defensible case to stakeholders and to track actuals against the plan.
Finally, remember to include opportunity value in your TCO. The ability to reassign FTEs to higher-value work and to improve customer outcomes are real economic benefits that tilt the decision in favor of agentic AI when the use case matches the strengths of the technology. Use pilots to gather concrete evidence, refine cost assumptions, and create a clear path to scale with confidence. This disciplined approach will reduce surprises, ensure that investments in automation align with strategic goals, and deliver measurable reductions in total cost of ownership.
Next step
Book the Opportunity Sprint